Reports
Generate, review, and schedule security reports, compliance audits, and coverage analysis for your API and AI infrastructure — all from one place.
A Report is an exported snapshot of your Levo data — API inventory, vulnerabilities, findings, compliance mappings, test coverage, or audit trails — scoped to an environment (and often a specific application or endpoint). You can generate a report on demand whenever you need one, or set up a schedule so it's generated and emailed out automatically on a recurring cadence.
Where to find Reports
Open Reports from the left navigation. The page has three tabs:
| Tab | What it's for |
|---|---|
| Reports | Browse the report catalog and generate a report on demand. |
| Past Reports | View, preview, and download every report that's been generated — manual or scheduled. |
| Scheduled | Create and manage recurring report schedules with email delivery. |
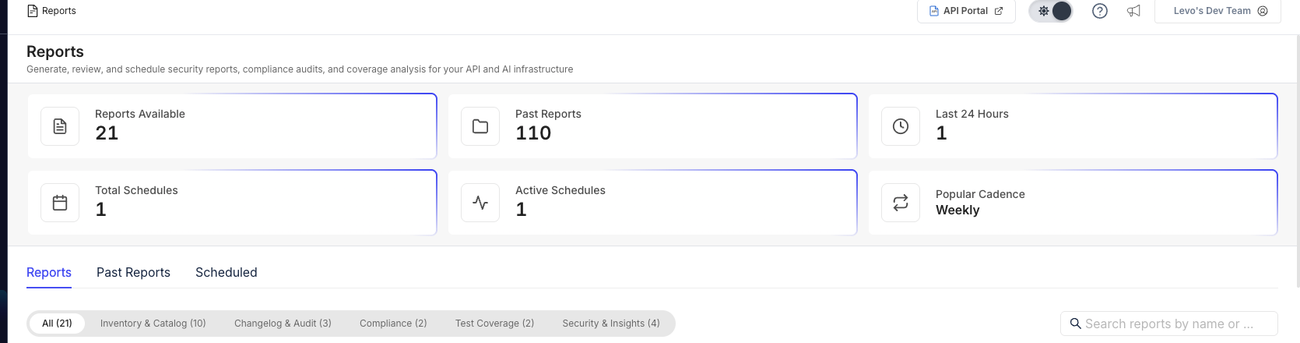
At the top of the page, an insights strip summarizes Reports Available, Past Reports, reports generated in the Last 24 Hours, Total Schedules, Active Schedules, and your Popular Cadence.
Viewing the Reports page requires access to Reports for your workspace. Generating, scheduling, or editing a report additionally requires edit access to tests/jobs, and deleting a schedule requires delete access. If a Generate, Schedule, or Create Schedule button is missing or disabled, ask your workspace admin for the right role.
What you can report on
The Reports tab organizes the catalog into five categories. Use the category chips or the search box (Search reports by name or keyword...) to find one quickly — each chip shows how many report types it contains.
Inventory & Catalog
| Report | What it contains | Formats |
|---|---|---|
| Application Inventory | Apps, endpoints, sensitive-data counts, and third-party services, per environment | CSV, PDF |
| Endpoints Inventory | Endpoint catalog — method/path, external-facing, auth status, PII presence, binding, created date, last trace | CSV |
| API Surface | Workspace-wide endpoint inventory across all environments, by API type (REST, GraphQL, gRPC, SOAP, MCP, AI) | CSV |
| Application Comparison Report | Side-by-side comparison of 2–4 applications — cross-environment endpoint matrix, auth, risk | CSV, PDF |
| Dormant API Report | Zombie or inactive APIs, filtered by application and inactivity window — PII, path, method, source, auth | CSV |
| Sensor Export | Sensor configuration, deployment, coverage, and traffic — name, type, version, last-24h spans | CSV, PDF |
| Component Status Report | Down or stale Satellites, sensors, and other components — hostname, type, environment, version, inactive duration, last reported | CSV |
| MCP Servers & Tools | MCP server inventory, tools exposed, auth required, risk level | CSV, PDF |
| AI Agents & Models | AI agent/model inventory, access frequency, prompt-injection risk flags | CSV, PDF |
| Auth Schemes Report | Distribution of auth schemes (OAuth2, API Key, JWT, Basic, None), with unauthenticated endpoints flagged | CSV, PDF |
Changelog & Audit
| Report | What it contains | Formats |
|---|---|---|
| Sensitive Data Report | PII/PHI/PCI/credential exposure, severity, first/last seen | CSV, PDF |
| Application Sensitive Data Report | Same as above, scoped to a single application | CSV, PDF |
| API Changelog Digest | Endpoints added or removed and breaking schema changes, with severity |
Compliance
| Report | What it contains | Formats |
|---|---|---|
| Audit Logs Report | Before/after actor actions with timestamp (UTC), source, success/failure | CSV |
| RBI Compliance Audit | RBI control mapping per endpoint, compliance status, application/endpoint metadata | CSV, PDF |
Test Coverage
| Report | What it contains | Formats |
|---|---|---|
| Application Test Coverage | Per-application test categories, susceptibility, pass/fail | |
| Environment Test Coverage | Tested vs. total apps/endpoints, susceptibility | CSV, PDF |
Security & Insights
| Report | What it contains | Formats |
|---|---|---|
| Vulnerabilities Report | OWASP category, CVSS, status, remediation | CSV, PDF |
| Endpoint Vulnerabilities Detail | All vulnerabilities for one endpoint, with evidence and fixes | |
| Findings Report | Findings by application, risk, and rule, with first/last seen — filter by passive API or web-app scans | CSV, PDF |
| Threat Feed | Detected threats and attack patterns, risk breakdown, top affected applications | CSV, PDF |
Generate a manual (on-demand) report
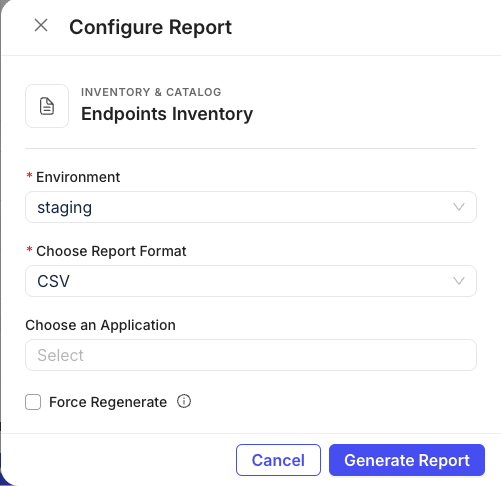
On the Reports tab, find the report you want and click Generate on its card.
The Configure Report drawer opens. Pick an Environment (some report types — such as Audit Logs and API Surface — are workspace-wide and skip this field; several others also offer an All Environments option).
Choose the Report Format — only the formats that report type supports (CSV and/or PDF) are offered.
Fill in any extra fields for that report type. These change based on what you picked, for example:
- Application (single) — Endpoints Inventory, Test Coverage, Vulnerabilities, Application Sensitive Data, Endpoint Vulnerabilities Detail
- Applications (multi-select) — Dormant API Report, RBI Compliance Audit
- Endpoint Method + Endpoint Path — Endpoint Vulnerabilities Detail
- Type (Zombie / Inactive) and, if Inactive, a Timeframe (1 / 3 / 6 / 12 months) — Dormant API Report
- Passive Kinds (API Passive / Webapp Passive) — Findings Report
- Report Type (Summary / Detailed) + Sensitive Type — Sensitive Data Report
- Component Type (Satellite, PCAP Sensor, eBPF Sensor, DAST Runner, AI Gateway, Tagger, etc.) — Component Status Report
- Aggregation Mode (Detailed / Aggregated) + Endpoint Tags — RBI Compliance Audit
- Application + a change window (Last 15 Minutes / Last Hour / Last Day / Last Week / Custom Range) — API Changelog Digest
Optionally check Force Regenerate to bypass the cache and rebuild the report from scratch, even if an up-to-date version already exists.
Click Generate Report.
Generation runs asynchronously. If a cached, up-to-date version already exists, Levo opens the preview immediately. Otherwise you'll see "Report generation started. Check Past Reports for status" — head to the Past Reports tab, where the row updates automatically (Pending → Processing → Completed) every couple of seconds.
View and download past reports
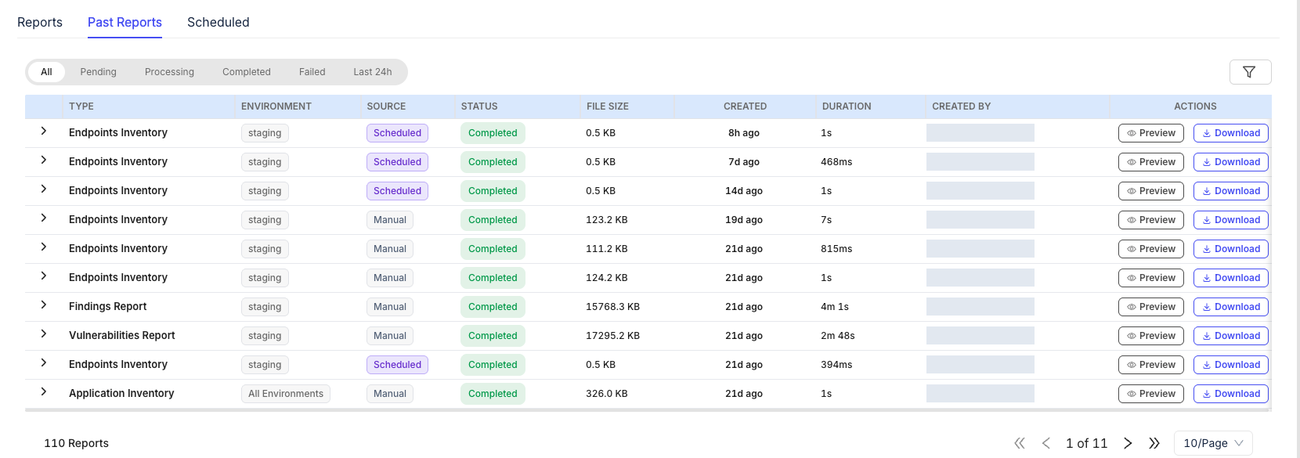
The Past Reports tab lists every report ever generated — manual and scheduled — with:
- Type, Environment, and Source (a Scheduled badge names the originating schedule, otherwise Manual)
- Status — Pending, Processing, Completed, Failed, or Expired
- File Size, Created (with a full timestamp on hover), and Duration
- Created By
- Actions — Preview and Download, enabled only once the report reaches Completed
Use the quick-filter chips (All, Pending, Processing, Completed, Failed, Last 24h) or open Filters for Status, Report Type, Environment, and a Created-At date range. Expand a row to see the applications/endpoints it covered and the raw request parameters used to generate it.
Clicking Preview renders the PDF inline or shows the CSV as tables — from there you can Download the same file.
A report only becomes downloadable once it's Completed. If a report sits in Processing for a long time or lands in Failed, try generating it again with Force Regenerate checked.
Schedule a recurring report
Turn any report into a recurring job with email delivery.
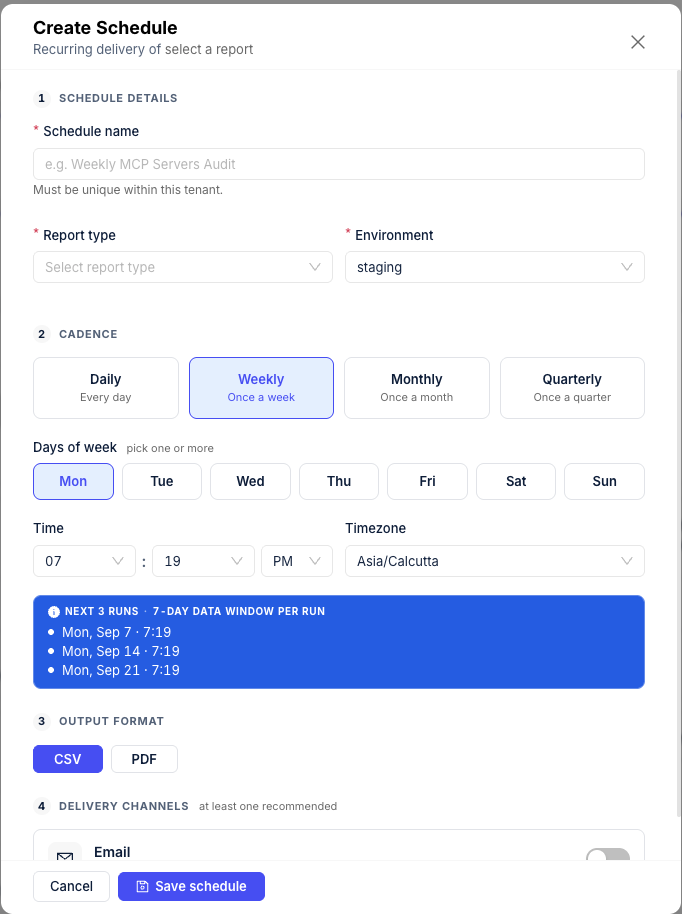
Go to the Scheduled tab and click Create Schedule (top right).
Schedule details — give it a unique Schedule name, pick the Report type and Environment (or All Environments, where supported), and fill in the same report-specific fields available in manual generation.
Cadence — choose Daily, Weekly, Monthly, or Quarterly:
- Weekly — pick the days of the week
- Monthly / Quarterly — pick the day(s) of the month
- Quarterly — also pick the quarter alignment (which months it fires in)
Then set the time of day and timezone. A Next 3 runs preview updates live so you can confirm the cadence before saving, along with a note on how much data window each run covers (24 hours for daily, 7 days for weekly, 30 days for monthly, 90 days for quarterly).
Output format — pick CSV or PDF, limited to what that report type supports.
Delivery channels — turn on Email to have completed reports sent out automatically.
Recipients (if email is on) — either toggle Send to all org members, add Additional recipients by typing an email and pressing Enter, or both. If you turn org members off and add no recipients, Levo warns you that email delivery will be skipped at run time.
Click Save schedule.
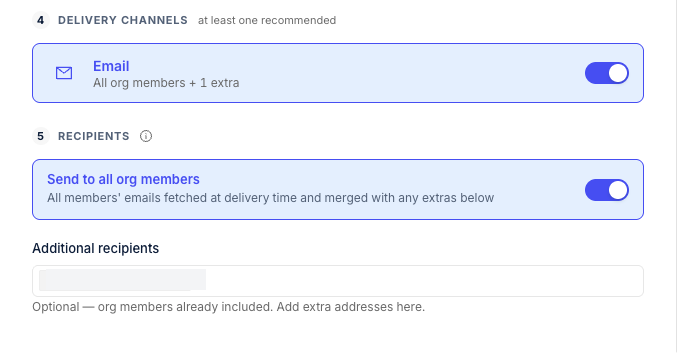
- Org members on, no extra recipients → sent to all org members.
- Org members on + extra recipients → sent to all org members plus the extras.
- Org members off, recipients listed → sent only to those recipients.
- Org members off, no recipients → nobody — email is skipped for that run.
Manage schedules
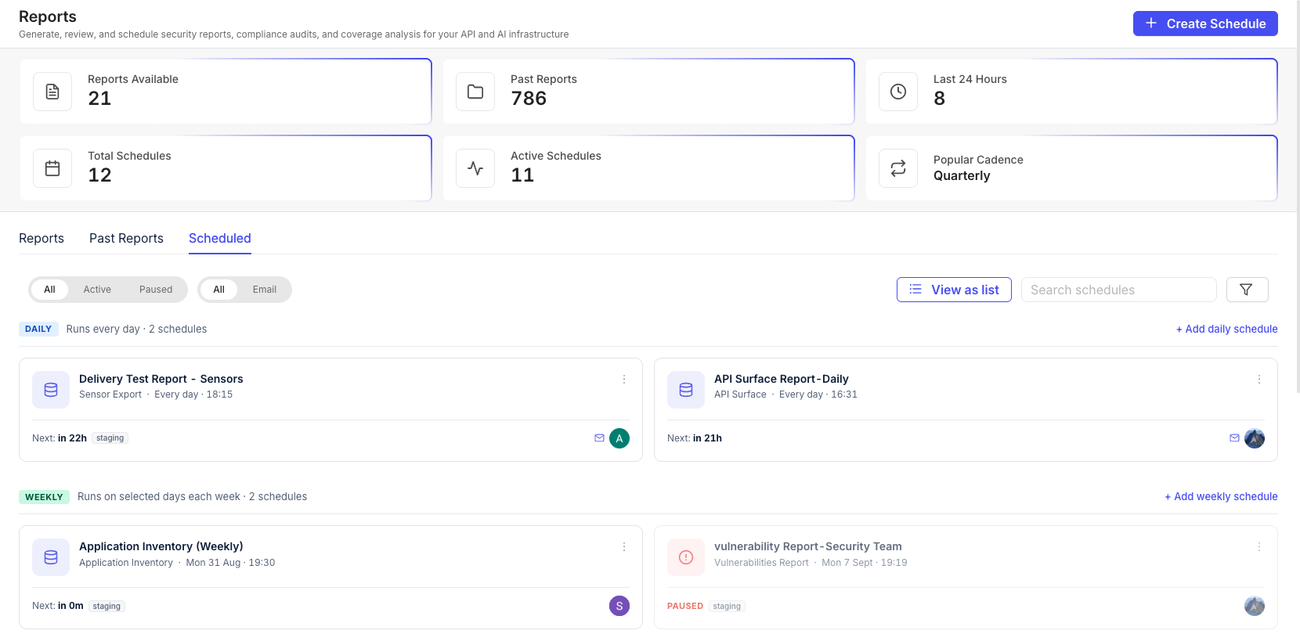
The Scheduled tab lists schedules grouped by frequency (Daily/Weekly/Monthly/Quarterly), or toggle to a flat list view. Each schedule shows its next-run countdown, an Active/Paused badge, its environment, owner, and whether email delivery is on. Filter by status (All/Active/Paused), delivery type, owner, or environment, or search by name.
Open the ⋮ menu on a schedule for:
- Run Now — trigger an out-of-cycle run immediately
- Pause / Resume — stop or restart future runs without losing the configuration
- Edit — change cadence, format, recipients, or report-specific fields
- Details — opens the schedule's history drawer: frequency, next run, status, timezone, who created/last modified it, and its 10 most recent runs (with a link to see the rest in Past Reports)
- Delete — permanently removes the schedule (this doesn't delete reports it already generated)
Next steps
- API Security Testing — the findings and coverage data behind the Vulnerabilities, Findings, and Test Coverage reports.
- DAST Scanner — web-app/API scan results feed the Vulnerabilities and Threat Feed reports.
- FAQs if you run into an issue generating or scheduling a report.